By Nelle Maxey
This report covers the 2017 Adverse Events data from Canada’s two national surveillance systems and Ontario’s provincial system.
The special subject in this report is the relationship between adverse events and vaccines, commonly referred to as causality. On page 3 of the report, a background on why adverse events surveillance systems were established and the industry approach to these systems is analyzed. When these safety surveillance systems were established, less emphasis was put on protecting vaccines and more emphasis on protecting children than we see now.
Recent changes to the terms used in causality assessments of adverse events is of great concern as it will further reduce the number of adverse events that will be assessed as related to vaccinations and therefore reported as AEFIs. Part 4 of the report discusses both the historical causality assessments and the new assessments in use today.
The 2017 report from the Public Health Agency of Canada (PHAC) on the Canadian Adverse Events Following Immunization Surveillance System (CAEFISS) is titled Vaccine Safety in Canada, 2017. It is even more disappointing than the last report, which was a Summary Report of adverse event reports for 2013–2016. Our rather scathing review on that report is found here.
We are sorry to report that the attenuated format of the Summary Report has been adopted for the 2017 Annual CAEFISS report, except even more AEFI data has been removed from public scrutiny in the new, modified format.
Changing Evidence?
Causing further consternation is the fact that an entirely new set of AEFI report numbers is presented as shown in our chart below. All of the colored lines in this chart are from PHAC previously published data.
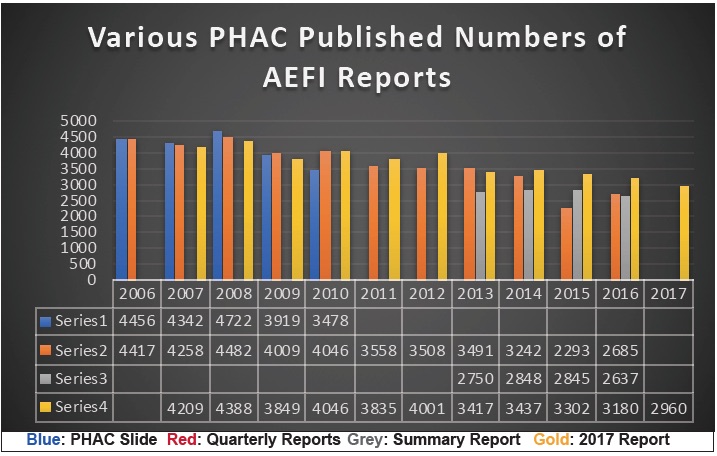
With all the ballyhooing about ‘evidence-based science’, we can only ask, why the ‘evidence’ keeps changing. Comparing the various report numbers—sometimes more, sometimes less than previously reported—all we can really conclude is that the AEFI data is being ‘managed’ for some purpose.
Look at the year 2015 for example. When the Quarterly Reports (red) were published in 2016 for that year, the numbers were substantially lower than in the Summary Report (grey) published in September of 2018, and those numbers were substantially lower than the numbers published in the Annual Report (gold) in December of 2018 (only 3 months later). Where did all these thousands of new reports come from?
Or look at the year 2009 where the ‘new’ numbers (gold) are less than the previously reported numbers (red & blue). What reports were discarded? And more importantly, why were they discarded?
We have no idea how many of these ‘new’ reports or ‘discarded’ reports were for serious adverse events, what age groups they fell into, what vaccines were involved, what the reporting rates were, what hospital utilization rates were, who recovered, who didn’t and who died.
Basically, the publishing of new AEFI total numbers for the last 10 years invalidates all of the previous CAEFISS reports and discussions therein and the comparisons and data discussions we made in our own safety reports about CAEFISS data.
As disconcerting as the new numbers are, more important is the data that has been removed from this report. For the first time since vaccine safety surveillance reports have been published in Canada, all information on suspect vaccines has been removed!
Below is just one of three tables regarding vaccines and AEFI reports published 26 years ago by Health Canada in their 1992 Adverse Events Report. There were also tables showing how many vaccines the child or adult received in combination along with corresponding AEFI report numbers and a 3-year comparison table for ten selected vaccines.

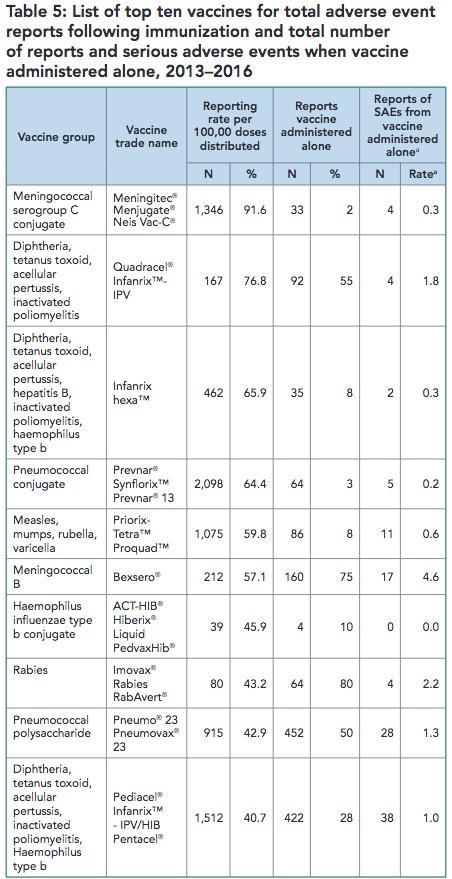
This information is no longer available in the 2017 CAEFISS Report. Table 5 in the Summary Report listed the top 10 suspect vaccines in AEFI reports. Note that 7 of the ‘top 10’ vaccines they list are vaccines given to infants and children less than 2 years old.
Removing this information means the 2017 CAEFISS Report is now protecting vaccines, not children.
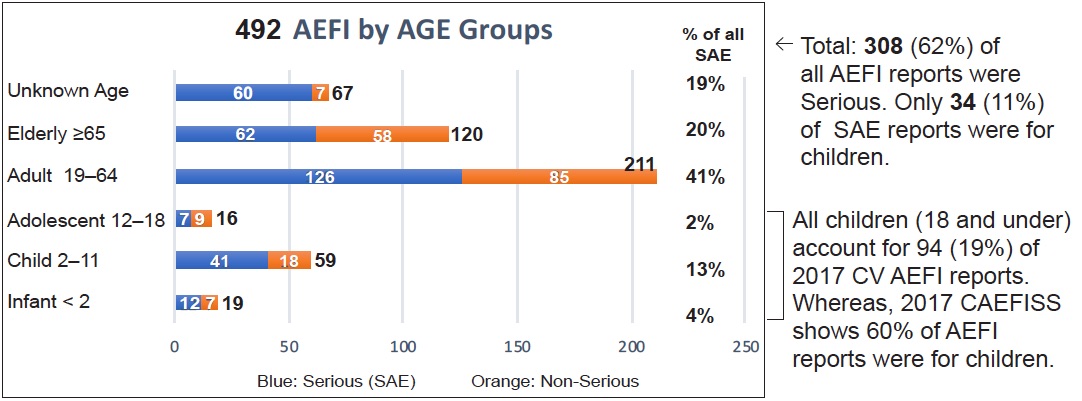
Other information has been removed as well. There are only three tables left in the 2017 Annual Report. Table 1 in the Summary Report gave the historical numbers of AEFI reports and reporting rates by age group. This table showed the overwhelming proportion of AEFIs experienced by the youngest age groups—less than 1-year old babies and less than 2-year-old toddlers. It has been removed from the 2017 Report.
Also gone is Figure 4 that not only had a bar chart of Serious and Non-serious reports in each subcategory of the Primary Reason for Reporting table, but also gave all the SAE report numbers in the text description.

Any information on SAEs is hard to come by in the 2017 Report. In fact, the number of Serious Adverse events experienced by children is not found anywhere in the 2017 Report. If a reader read all the way to the end of the report, past the closing notes and the twenty references, they would see this note:
No link is provided to make the request, but we did find an email and requested the information, which we detail in our report.
So one can see that age-related information for serious adverse events (SAEs) and much for all AEFIs has vanished from the report.
Since ‘vaccine hesitancy’ is the new watch word, it appears our public health officials and their industry-linked experts and advisors have decided that the solution to their problem is to withhold AEFI information. What we are seeing over time with the CAEFISS reports in their various iterations is a slow removal of vaccine safety surveillance information from the public eye. We are only being given very selective information. Unlike the CV database where the public has access to AEFI reports, CAEFISS AEFI reports are all kept behind closed doors. The public’s only access to the bulk (greater than 80%) of Canadian adverse events reports is through these increasingly nontransparent and uninformative Public Health Agency of Canada (PHAC) CAEFISS reports.
As usual, information had to be teased out of what was given in the CAEFISS Report.
We prepared some basic information — “It’s a Simple Story”—on the first page of the report. You can download the one-page pdf here. None of this basic information in “It’s a Simple Story” was given in the report. Here is one of the charts.
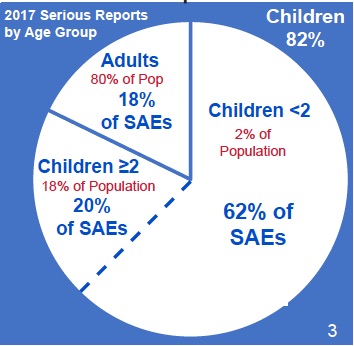
That’s right. In 2017 two percent of the population—namely infants, babies and toddlers less than 2 years old—experienced 62% of all Serious Adverse Events (SAEs). This means they died or suffered a life-threatening event or were hospitalized or disabled following vaccination. The number breakdown is in this chart:
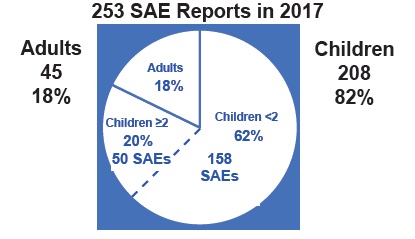
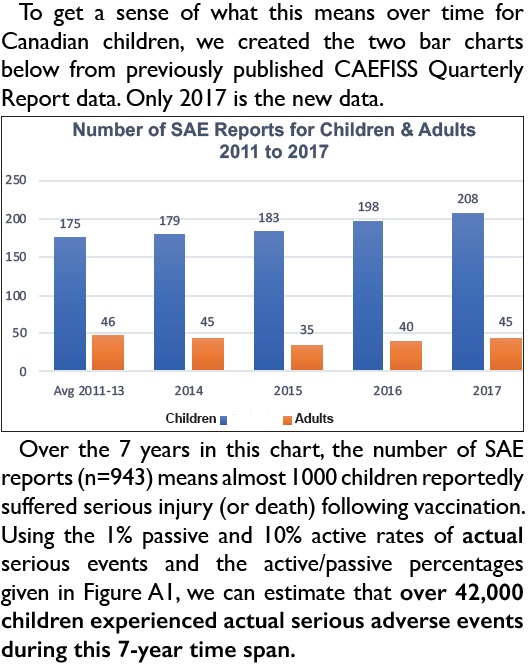
To understand what this means for Canadian children, we created the chart below from previously published data (only 2017 is new data).

Over the 7 years in this chart, the number of SAE reports (n=943) means almost 1000 children reportedly suffered serious injury (or death) following vaccination. Using the 1% passive and 10% active rates of actual serious events and the active/passive percentages given in Figure A1, we can estimate that over 42,000 children experienced actual serious adverse events during this 7-year time span.
Reporting Rates
This is one more thing, the protectors of public health think we don’t need to know. But reporting rates are important since they remove the bias of the different population size for each age group. There are many more people in the age group from 18 to 65 than in any other group, so of course they have the most reports; but they actually have the lowest reporting rates.

In the Summary Report, reporting rates by age group were given. In 2016 the AEFI reporting rates per 100,000 population were listed as follows:
CHILDREN ADULTS
< 1 year old 124.9 18 to < 65 4.0
1 to < 2 years old 130.6 65+ 5.3
2 to <7 years old 12.5
7 to < 18 years old 12.2
In the 2017 Report only the rates for the two youngest age groups are given: ““The highest reporting rates were seen in children one to less than two years of age (136.5/100,000 population), followed by infants less than one year of age (119.6/100,000 population).” But with other age group rates not available for comparison in the report, the reader may find it hard to understand the implications of this isolated information. Also, with no historical data given the reader may not be aware that the reporting rates have increased for the 1 to <2 year old age group: from 130.6 to 136.5 reports per 100,000 population in the last year alone. That information is all contained in the ‘supplemental information’ that must be requested. There is no question that this restricted, so-called ‘supplemental’ information should be part of the standard reporting of CAEFISS AEFI data and not hidden from the public in this way.
One more bit of chicanery in the report must be mentioned. When discussing the number of reports in each category of injury that was the primary reason for reporting (Table 1), the report tells us twice ‘to exclude the Other category’. Here is one quote followed by the Figure it is commenting on:
“Excluding the “other” event category for children under one year of age, the most commonly reported AEFI was rash alone, followed by vaccination site reactions (Figure 3).”

The first column is children less than 1 year old. The blue portion represents the category ‘Other’. It is clear to anyone that what the report is blithely saying is to ignore the category with the largest proportion of Adverse Event reports (40% of all reports) for this age group.
Further, the Other category contains a large portion of serious adverse events as shown in Table 1 in the report. To understand how many children and adults were being reported as experiencing SAEs in the categories, we calculated the number of SAE reports from the total report numbers and % of SAEs given in all categories in Table 1. As you see, Neurologic events rank first in the number of SAE reports and the ‘Other’ category, which we are twice told to ‘exclude’, ranks second.

The information above is impossible to discern when reading the CAEFISS report. We also produced a page of simple line charts that show the number of AEFI reports received for each of the 6 categories in the chart above with the highest number of reports. Children have the majority of reports in all categories except Vaccination Site reactions. The reader can download that one-page pdf here.
The categories adopted by CAEFISS as listed above are unique to them alone. Provinces categorize events into standard accepted categories. For example, most of the adverse events listed in the ‘Other’ category by CAEFISS are normally listed as Systemic Events, except for one that is normally listed as a Neurological Event. This is just one more way that CAEFISS obfuscates the data and makes it difficult for the public to understand what is actually happening.
The CV database has also changed formats and reporting timelines. We no longer see Quarterly reports, rather reports are issued twice a year. We collated the data from the two 2017 Biannual Reports in the information we present in the report.
We continue with our annual comparison charts for the CV database. This is the database that manufacturers are required by law to report Serious Adverse events to. Therefore, it is not unusual to have a high percent of Serious Reports.

A large decline is seen from 2015 to 2016 in the number of all AEFI reports received. But the number of Serious reports remains fairly stable in the low to mid 300s.
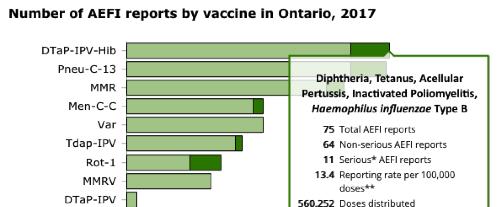
This database is still reporting the vaccines with the largest percent of AEFI reports. The 3 vaccines shown in this table account for 70% of all AEFI reports received for the two years, 2016 and 2017.

Deaths
No deaths were reported in the January to June 2017 CV Report. In the July to December 2017 CV Report there were 6 deaths reported. Here is the quote discussing those deaths:
“There were 6 reports with an outcome of death. These reports involved patients between 19 and 70 years of age: 2 females, 3 males and 1 with unknown gender. One report was for Zostavax from a healthcare professional and 5 were for influenza vaccines from social media extracted by the company. The information provided was not sufficient to adequately assess the causal association with the vaccines.”
“The company” in the above quote means the manufacturer or distributor of the vaccine. Very interesting they are “extracting” death data “from social media”! No wonder the information to assess causality is lacking.
Another format change in the reports is a bar chart showing serious (orange) and non-serious (blue) AEFI reports by age groups. Previous reports did not have this information, so it is a welcome addition. However, the choice of age groups makes it impossible to compare to CAEFISS data except for the three broad categories of all children, adults or the elderly. Combining the data from the two CV reports and adding the total number of reports for 2017 results in the bar chart below. The CV surveillance captures few serious reports for children.
Drug Ineffectiveness and Vaccine Failure
In the report for the first half 2017, we again see (as we did in 2016) that drug ineffectiveness is listed as the most common adverse event reported. We searched the CV database for the 3 vaccines with highest frequency of reports—Influenza, Zostavax (shingles) and Pneumococcal—and also for Hib, MMR and MMRV vaccines. We found the following data on Drug Ineffectivenes or Vaccine Failure listed as an adverse event. Vaccine Failure includes reports we found with illness vaccinated against listed as an adverse event.
Vaccine Drug Ineffective Vaccine Failure
Influenza 9
Zostavax (shingles) 18 17
Pneumococcal 17 6
Hib (infants) 3
MMR or MMRV 3 one chicken pox, one measles, one mumps
The list above shows we found 73 cases that reported Drug Ineffective or Vaccine Failure. That means 15% of the 492 CV AEFI reports in 2017 stipulated ineffective or failed vaccines. And those are only ones we found. There could be more as the public search function of this database is flawed.
Ontario’s 2017 Annual Report on Vaccine Safety is a much more comprehensive and informative report than either of the national surveillance reports. It contains 50 pages (compared to CAEFISS’s 7-page report) of graphs, charts and detailed explanations of information. It could well be used as a model for better national reporting on vaccine safety.
The report itself, coupled with the on-line Vaccine Safety Surveillance Tool, reveal a lot of information for public inspection. All of the omissions discussed in the CAEFISS section are readily available to Ontario residents. For example, below is a screen shot from the Surveillance Tool, which details for each individual vaccine the total number of AEFI reports, the number of Serious reports, the reporting rate per 100,000 doses distributed and the number of doses distributed. This screen shot is for the DTAP-IPV-Hib vaccine given in 4 doses to infants at 2, 4 and 6 months and again to toddlers at 18 months. We encourage all Ontario parents to explore this useful tool.
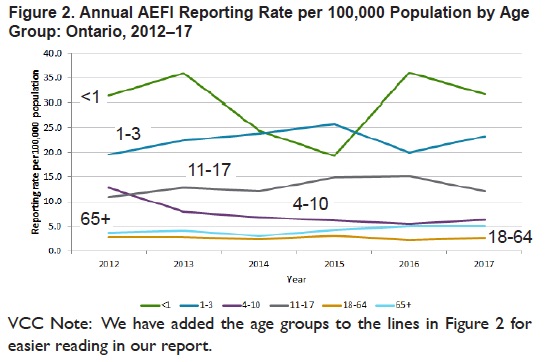
The 2017 Ontario Vaccine Safety Report uses simple graphics and gives detailed explanations in the Results section of the report. Figure 1 shows 6-year annual comparisons for number of AEFI reports and reporting rates. The accompanying text is comprehensive and easy to understand.

Rather than obscuring age group reporting rates as CAEFFIS does, Ontario presents a simple line chart for age group reporting rates over a 6 year time period in Figure 2.
Vaccines in Ontario
This section opens with the following information:
“In 2017, there were approximately 8.5 million doses of vaccines distributed in Ontario for the publicly-funded immunization programs. Using net doses distributed for each routine, publicly-funded vaccine as the denominator, the highest vaccine-specific AEFI reporting rates in 2017 were observed for Zos, HPV9 and Men-C-ACWY vaccines (40.4, 35.0, 32.8 per 100,000 doses distributed, respectively; Table 1). Both HPV9 and Men-C-ACWY vaccines are delivered through school-based programs and Zos became a publicly-funded vaccine program for persons between 65 and 70 years old in September 2016…Overall, vaccine-specific serious AEFI reporting rates for all vaccines for which rates could be derived ranged between zero and 3.1 per 100,000 doses distributed. The vaccine-specific serious AEFI reporting rates based on doses distributed were highest for two vaccines given routinely in infancy, Rot-1 and Pneu-C-13 (3.1 and 2.1 per 100,000 doses distributed respectively).”
All vaccines for all age groups are represented in Table 1 on page 16 of the Ontario Report. Below is just a portion of the table for the Infant and Childhood vaccines. Note both number and reporting rates per 100,000 doses distributed are given both for AEFI reports and SAE reports. This is a far cry from what we saw in the CAEFISS Report were NONE of this information was available.

The report continues on page 20 with Table 2 that shows the number and distribution of AEFI and SAE reports in each adverse event category where at least one report was received in 2017.
This table is very different from the CAEFISS AEFI Category table we discussed above. Notably all of the events in the CAEFISS ‘Other’ category (the one they wished us to ‘exclude’) are actually Systemic Events except paraesthesia (pain, numbness, weakness, pins and needles in limbs) that is defined as a Neurologic Event. Rash is also a systemic event. Why CAEFISS has chosen to make up their own categories for AEFIs is unexplained. The definitions used in Ontario and other provinces are the generally accepted categories for AEFIs. Below we show just the Systemic Events portion of Table 2 from page 20 of the Ontario Report.

We point out in our analysis that CAEFISS didn’t manage to pick up the 4 Serious rash events Their Category table shows no serious rash events in any of the 3 places they list rash on the table.
The report next details Serious Adverse Events, with text revealing ages and percent of children and adults who suffered serious events. We created this pie chart with that information.

We also show Appendix 4 from page 45 of the Ontario Report that details all the Serious Adverse events, the age of the affected and details of the event. We were deeply disturbed to see that CAEFISS 2017 Report did not pick up the SUDS death reported there, as follows:
“Sudden death, age group 1-3, DTap-IPV-Hib, Occurred within 24 hours of receiving routine immunization. Possible natural causes identified on autopsy.”
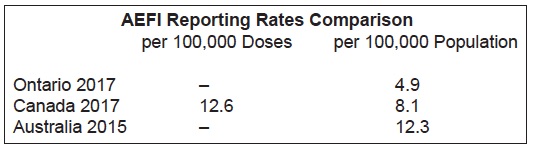
Ontario has a very low AEFI reporting rate compared to other provinces. This is acknowledged on page 26 of the report:
“Ontario’s AEFI reporting rate has been consistently lower relative to other jurisdictions…The causes of Ontario’s low reporting rate are likely multifactorial, including under-reporting by healthcare providers, which is discussed in further detail in previous reports.”
We created this chart with data. As the reader can see, Ontario’s population-based reporting rate is 40% lower than the national rate, and 60% lower than the Australian rate.
The low reporting rates in Ontario are especially concerning since Ontario functions under the Immunization of School Pupils Act (ISPA), which is exerting increasing pressure on parents to vaccinate their children despite safety concerns on the part of many parents.
In section we review the use of causality assessments to determine whether vaccines actually cause AEFIs. Prior to 2013 when WHO issued their first edition of new causality assessment Guidelines (since replaced with the 2018 edition), the WHO Brighton causality assessment guidelines were used. The WHO/Brighton Causality Guidelines assessed causality by six Criteria as shown here:
WHO/Brighton Causality Assessment Criteria
Very Likely/Certain – Clinical event with a plausible time relationship to vaccine administration, and which cannot be explained by concurrent disease or other drugs or chemicals.
Probable – Clinical event with a plausible time relationship to vaccine administration, and is unlikely to be attributed to concurrent disease or other drugs or chemicals.
Possible – Clinical event with a plausible time relationship to vaccine administration, but which could also be explained by concurrent disease or other drugs or chemicals.
Unlikely – Clinical event whose time relationship to vaccine administration makes a causal connection improbable, but which could plausibly be explained by underlying disease or other drugs or chemicals.
Unrelated – Clinical event with an incompatible time relationship to vaccine administration, and which could be explained by underlying disease or other drugs or chemicals.
Unclassifiable – Clinical event with insufficient information to permit assessment and identification of the cause.
The new 2018 WHO Guidelines have removed three of these categories—probable, possible, and unlikely. Under today’s criteria, an AEFI with temporal association (plausible time relationship to vaccination) is either certain to be caused by vaccines as documented in product monographs or medical literature, or its cause is unrelated to the vaccine or it is unclassifiable. This removes thousands of AEFIs from scrutiny for causation.
In the section of causality assessment called “Yesterday-Brighton Criteria”, we analyse how the criteria were applied to Canadian AEFIs. We discovered that only a very few AEFIs were actually assessed for causality as determined by a committee of experts.
Causality assessments of selected AEFIs used to be published in CAEFISS vaccine safety surveillance reports. Here is a table reproduced from the 2006 CAEFISS Report. ACCA is the acronym for the expert Committee that assessed 502 selected SAEs from the eight years of data. They combined some of the Brighton categories.

The result was that 48% (21+27) of these SAEs were found possibly or probably caused by vaccines and 52% were found not likely caused by vaccines. Under the 2018 WHO Causality Assessment protocol hardly any would even be classified as AEFIs. (We cannot determine how many exactly because the Brighton criteria category “Certain” was combined with “Probable” in the above chart.)
We found very little information on causality assessments for other countries, besides one very limited report from the USA for one year only with only 100 AEFIs examined. This report had similar results as the Canadian studies.
However, we did find an excellent 2010 report from the Netherlands titled, Adverse Events in the Netherlands Vaccination Programme. This report is 145 pages long and contains analysis of AEFI reports for 2010 as well as a review of AEFI reports from 1994. That’s 17 years of comparisons. Some of the data is reviewed in our report, However, the entire report is remarkable in its approach to AEFI reporting, beginning with the first statement that openly and statistically addresses the true public concern regarding vaccine safety:
“In 2010, 800,000 children received one or more vaccines on 1.3 million dates, with more than 7 million vaccine components. There is always some chance of adverse reactions but these are usually not severe, though sometimes frightening. This year, RIVM received 1380 reports of adverse events following immunization (AEFI).”
Another example of the thoroughness of their approach is this statement on causality:
“We include in our aggregated analysis and annual reports all reported adverse events for transparency, with inclusion of causality assessment since this is more informing than a non-assessed list of reported events…”
The contrast with Canadian causality assessment is sharp. First, they assess all AEFIs, not just a handful of the most serious selected behind closed doors. Second, they publish all of the assessments “since this is more informing than a non-assessed list of reported events”. In Canada, all we see are uninformative, non-assessed lists of AEFIs with a few sentences (if that) on causality assessments.
The upshot is that for the 7 years covered in the Netherland’s report all 8,612 AEFIs received were assessed for causality. Between 72% and 83% of the reports were considered certain, probable, or possible to be related to the vaccines given. The certain, probable and possible causality averages were also given for a large 17-year time span as follows:
1994-2004: 82% (DPT phased out after 2004)
2005-2009: 76% and
2010: 78%
For all of the reasons discussed in our report, we consider the 76%–78% range to be a much more reliable Brighton causality assessment rate for all AEFI reports than that derived from either the Canadian or American data that was less inclusive, had smaller samples over shorter time periods and found 47% to 48% of reports were certainly, probably or possibly related to vaccines.
The last section of our report discusses the new, revised 2018 WHO criteria with examples from their manual. We then present excerpts of an extensive Critique of these new criteria for causality assessment from Drs. Puliyel and Naik published in May of 2018.
Here is Puliyel’s chart of the WHO algorithm used to determine what is to be considered an AEFI report that merits causality assessment.

As he says about the revised WHO causality assessment process, ““Paradoxically, the AEFI algorithm is said to be for vaccine safety. Perhaps we need a scheme for public safety rather than vaccine safety.”
This quote makes very clear his concerns for children with this new causality assessment system:
“The causality assessment of 132 serious AEFI cases uploaded on the website of the Ministry of Health and Family Welfare in India illustrates the consequence of deploying this new classification. 54 of these babies died, whereas 78 survived. The causality assessment found 50% of those who survived had reactions to vaccination but not even one death was classified as vaccine-related. Nearly all the deaths (96%) were simply classified as unclassifiable or coincidental, presumably because death has not previously been acknowledged as an adverse event caused by this vaccine. Children admitted to hospital after vaccination with intractable convulsions, could be classified as having a vaccine-product related reaction, but if they died, the deaths would be classified as ‘coincidental deaths’.”
We conclude that over the last 75 years of childhood vaccination programs in Canada, the number of parents who have held their damaged children in their arms is vast and continues to grow. These parents know what happened to their children. They and their family members will always know as they care for and mourn their damaged and their lost.
Denying that vaccinations could have caused this death and injury—by physicians and their professional associations, by public health employees who administer vaccines and by the entire Public Health bureaucracy from the Provincial to the Federal level—has further undermined public trust.
The Canadian public deserves recognition of their right to informed consent, which includes the right to information and also to refusal of medical procedures of any kind that they may deem as too great a risk.
Instead of scapegoating concerned parents, what needs to be addressed are five things:
1) Deficiencies in our Canadian surveillance systems.
2) Establishment of new guidelines for true, evidence-based safety testing of vaccines.
3) Application of newer, evidence-based, peer reviewed science on the plausible biological connections between vaccines and AEFIs.
4) Training of medical professionals on the relationships of AEFIs to various injuries and diseases and the importance of reporting (not denying) AEFIs.
5) Institution of a National Vaccine Injury Compensation Program.
If the above were to be addressed, this would necessarily lead to a reassessment of the current vaccination schedules, the policy decisions that led to them and the burden of injury they place on children in particular and on the public at large.
Vaccine safety is indeed a case of “Honesty versus Policy” as Dr. Humphries states. And “AEFI-denialism” as Dr. Puliyel calls it, will ultimately prove to be a lost cause. As are all such schemes that are not based on compassion, truth and the constantly unfolding complexities of the natural world that scientists continue to reveal.
For a printable PDF of the Summary click here
Correction: If you downloaded the Summary pdf or the full Safety Report pdf prior to Saturday Feb 23, 2019 please replace with new pdfs now linked on the site.
Report on the Canada Vigilance Database- What the Public Sees – by Nelle Maxey – April 2015
Update Report on the Canadian Adverse Events Databases by Nelle Maxey – Summer 2015
Vaccine Safety Report – An analysis of data & databases available to the Canadian Public by Nelle Maxey – March 2016
Vaccine Safety Report 2 – An analysis of 2015 Adverse Events Data & Databases by Nelle Maxey – November 2016
Vaccine Safety Report 3 – An analysis of 2016 Adverse Events Data & Databases by Nelle Maxey – June 2018
Review of the 2018 CAEFISS Summary Report by Nelle Maxey – October 2018
Further reading:
Nelle writes to the Canadian Health Minister:
Unexplained Delays in Canadian Vaccine Adverse Events Reporting – From February 2018
“Vaccine Choice Canada is deeply concerned that the public reporting of adverse events by both PHAC and MedEffect™ Canada are for unexplained reasons in hiatus. We appeal to you to look into this matter and explain why this hiatus has occurred as it directly affects the ability of the Canadian public to make informed decisions regarding vaccines.”