Scroll down for further reports including March 19, 20, 21 & 29, 2020 National Data …….
For daily updates from the Government of Canada – Epidemiological Summary – click here.
For the Provincial and Territorial reporting – click here.
By Nelle Maxey March 18, 2020
On Monday March 16th, BC’s Medical Officer of Health Dr. Henry mentioned that only 6 people were currently hospitalized with Covid-19 in BC. (See at 1 minute in this video.) Meanwhile she announced that all elective surgeries were being cancelled to make room for Covid-19 admissions. (See at 7min 30sec in this video).
This peaked my curiosity, so I went looking for hospitalization data from all provinces. I found that Alberta had 5 hospitalized cases, 2 of whom were in ICU as of March 17 th. I found no data on hospitalizations for Ontario or Quebec or other provinces/territories. I did however discover this site from the Government of Canada: Coronavirus disease (COVID-19): Outbreak update.
A good chart of case numbers of all Canadian jurisdictions is posted at the link. (See screen shot below.) Here I learned that 12% of 211 cases have been hospitalized. That would mean 25 cases in all of Canada hospitalized. Since BC and Alberta had 11 cases hospitalized, the other 14 cases hospitalized were probably from Ontario and Quebec as they have the other large number of cases. Other interesting information: 85% of cases are travelers and their close contacts. There are no age breakdown of cases anywhere that I can find. Most provinces, including BC, have even quit giving age details.

Source: https://www.canada.ca/en/public-health/services/diseases/2019-novel-coronavirus-infection.html
In the section of this website for ‘health professionals’, I also found an Epidemiological Curve accurate to Tuesday, March 17. It is for only 260 of the 569 confirmed cases listed in the above chart for Wednesday morning. Either PHAC doesn’t have complete data for all cases or cases are already dropping off. Wouldn’t that be ironic! All very mysterious…Look forward to seeing an update on this curve!
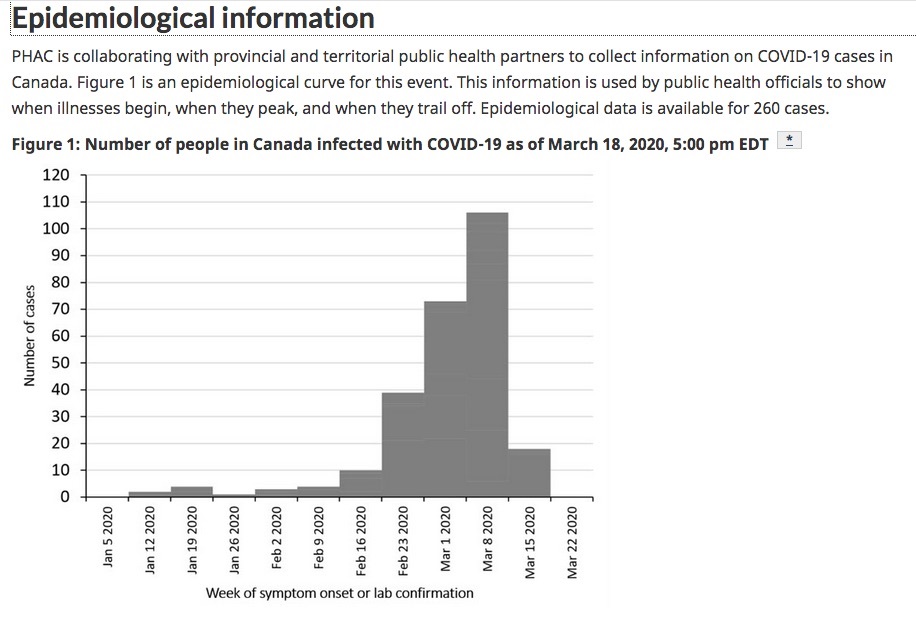
Source: https://www.canada.ca/en/public-health/services/diseases/2019-novel-coronavirus-infection/health-professionals.html#epi
I will update information as it comes in.
By Nelle Maxey on March 19, 2020
Link to the full report for March 19, 2020 in PDF format here.
By Nelle Maxey on March 20, 2020
As of last evening at 6:30 pm the national website reports 846 confirmed cases and 27 probable cases in Canada.
Four provinces have 94% of confirmed cases:
British Columbia 271
Ontario 258
Alberta 146
Quebec 121
The epidemiologic summary page has been completely transformed with much data added:
On this page
The updated Epidemiologic Curve, Figure 3, is found in the Temporal Distribution section.
As predicted, It appears to be flattening a bit prior to social distancing, border closures and other measures instituted recently having time to take effect.
However, new case numbers are likely to continue to move up and down (hopefully with lower highs as new cases diminish).
Both BC and Ontario have reported new cases not shown on the chart yet. The shaded area is likely to change as reports come in.

The new Demographic Section contains an Age Chart and table. They confirm our suspicion yesterday when inspecting the Ontario age data that people of all ages are receiving positive tests, and far more cases are positive in younger and middle age adults than in older adults. This is due to travel-acquired infections and close contacts at the moment. If community spread accelerates, age demographics will likely change.
The new Symptoms & Severity Section reports deaths and hospitalizations across Canada as follows:
The new Probable Exposure Section reports 69% of confirmed cases are due to travellers and their close contacts, 20% are in community settings and 11% are pending investigation.
Links to all jurisdiction websites are provided in the last section.
Link to the full report for March 20, 2020 in PDF format here.
By Nelle Maxey data update for March 21, 2020
If you read this article you will see that the latest epidemiologic curve for Canada is assuming the classic bell shape discussed there. This is good news.
The epidemiologic curve based on number of new cases for Canada is found here: https://www.canada.ca/en/public-health/services/diseases/2019-novel-coronavirus-infection/health-professionals/epidemiological-summary-covid-19-cases.html
It changes once or twice a day, depending on the entry of data from reports that the Public Health Agency of Canada receives. Only cases with full demographic data are used in the charts below. The total reported confirmed cases in Canada as of this evening was 1,231. So the charts below are reflecting about 68% of all cases. The actual numbers are in the long descriptions below the charts. The shaded area in the epi curve shows the 7 days they expect the data will change as more complete reports are received.
Below are the two charts as published this morning and the age group data:
https://www.canada.ca/en/public-health/services/diseases/2019-novel-coronavirus-infection/health-professionals/epidemiological-summary-covid-19-cases.html
Cases over time
The date of symptom onset of the first case of COVID-19 in Canada was January 15, 2020. Figure 2 and Figure 3 both show the COVID-19 case count over time. While Figure 2 displays the total (cumulative) number of cases per day, Figure 3 displays the number of new cases per day.
Figure 2. Cumulative COVID-19 cases (n=839Footnote 1) in Canada by date of symptom onsetFootnote 2 as of March 21, 2020, 9:00 AM EST.
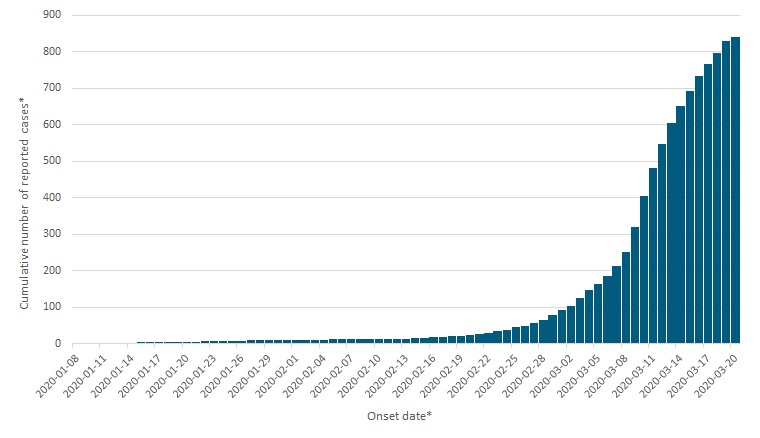
Figure 2 – Long description
Figure 3. New reported COVID-19 cases (n=839Footnote 1) in Canada by date of symptom onsetFootnote 2 as of March 21, 2020, 9:00 AM EST

Data note: The shaded area represents a period of time (lag time) where it is expected that cases have occurred but have not yet been reported nationally.
Figure 3 – Long description
Of the COVID-19 cases reported in Canada to date, approximately half (54%) are male. Approximately one third (30%) of cases are 60 years old and over (Figure 4).
Figure 4. Age distribution of COVID-19 cases (n=839) in Canada as of March 21, 2020, 9:00 AM EST

By Nelle Maxey on March 29, 2020
March 29 Changes to PHAC data information
PHAC has made numerous changes to their data presentation in the last few days.
Current Situation
The main link now opens to an interactive map rather than a table for the Current Situation. The map has 3 choices: total cases, confirmed cases, total deaths. The first two options are virtually the same.
Other interactive features include hovering over a province to see cumulative data in a line chart to the right of the map. Under this are an animated ‘play’ button that takes the map through time and a data download file using the ‘csv’ button. Access to the actual data is a significant change. Below the map, the ‘text description’ button contains the table of data we formerly saw. Click on the main link above to access the Current Situation map.
Epidemiologic Data is linked as before below the map, but there is now a pdf file available as well.
A detailed epidemiologic summary is available. A full epidemiologic report is also available in PDF.
The pdf file is a great addition as it is a permanent record that can be easily downloaded every day.
When you open it, in the first few paragraphs you are directed to another website from the University of Saskatchewan.
This is a wonderful site, with data for each province, not just the national data as PHAC presents.
The data is comprehensive and includes an epi curve (new cases by day) as well as cumulative cases and individual case listings.
Other changes to the PHAC data
For example, the EPI Curve is proceeded by the statement:
“Please note that this section onwards of the epidemiological update is based on limited data (n=2,811).
Each section’s table and/or chart title gives the number of cases (n) represented by the data.
There are many other changes including much more detailed tables of hospitalizations, age group cases and so forth. As well, a section on USA cases and International cases has been added, both with maps.
Please see the attached PDF file – DAILY EPIDEMIOLOGY UPDATE Updated: March 28, 2020, 11:00 AM EST